Full page
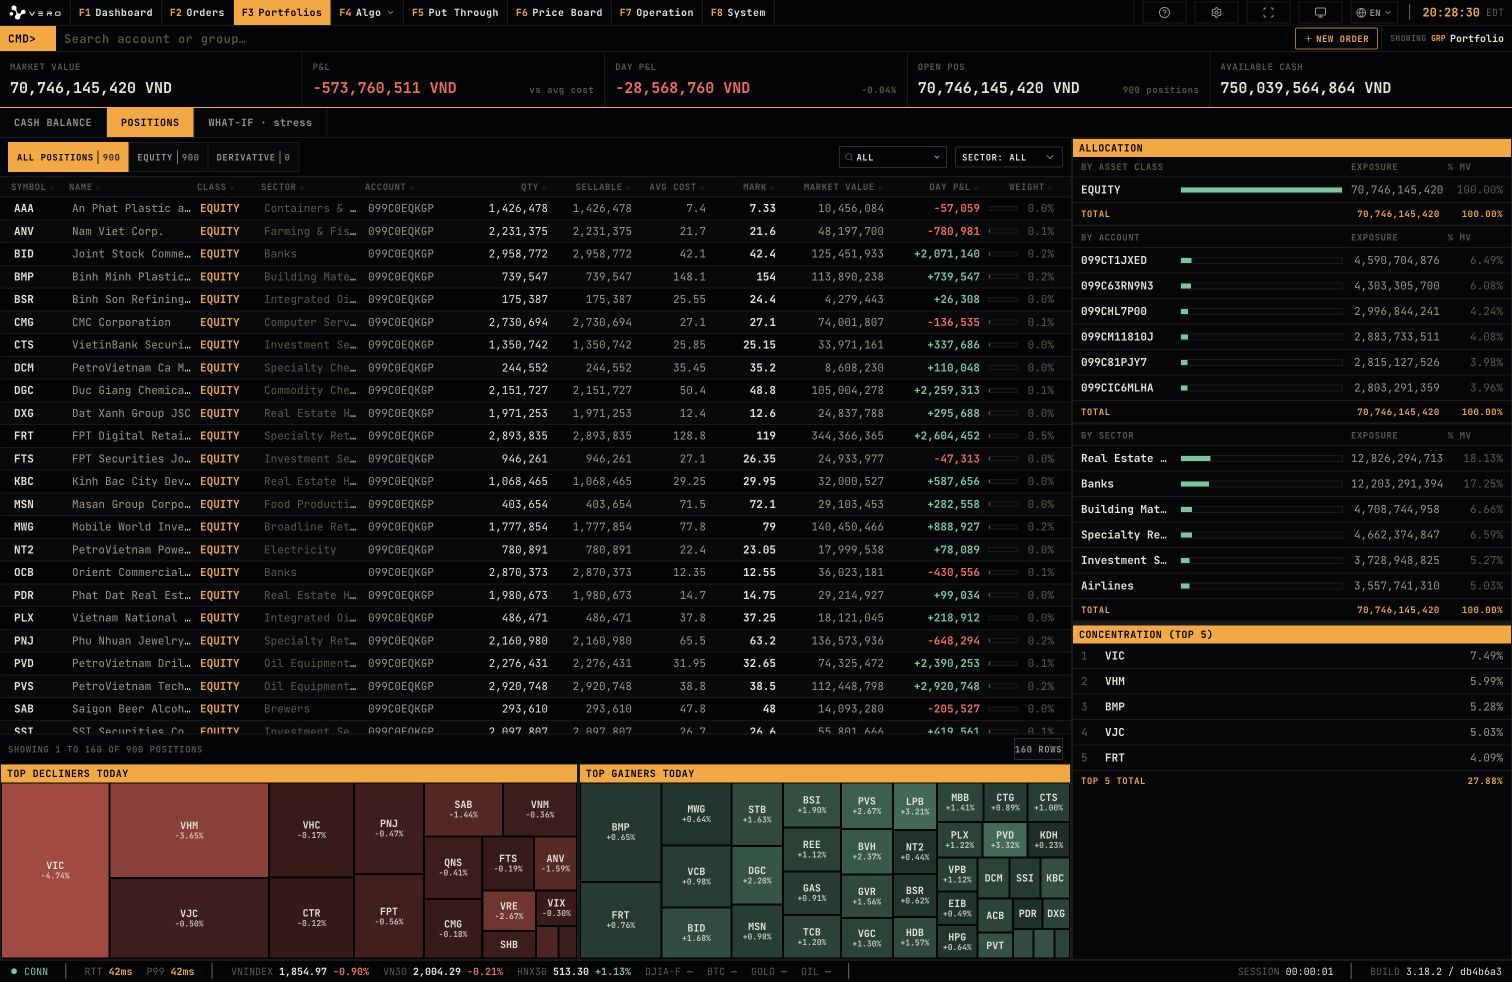
KPI Summary
The KPI strip displays market value, P&L, day P&L, open position count, and available cash.
Positions Table
The positions table lists symbol, account, quantity, sellable quantity, average cost, mark, market value, day P&L, and weight.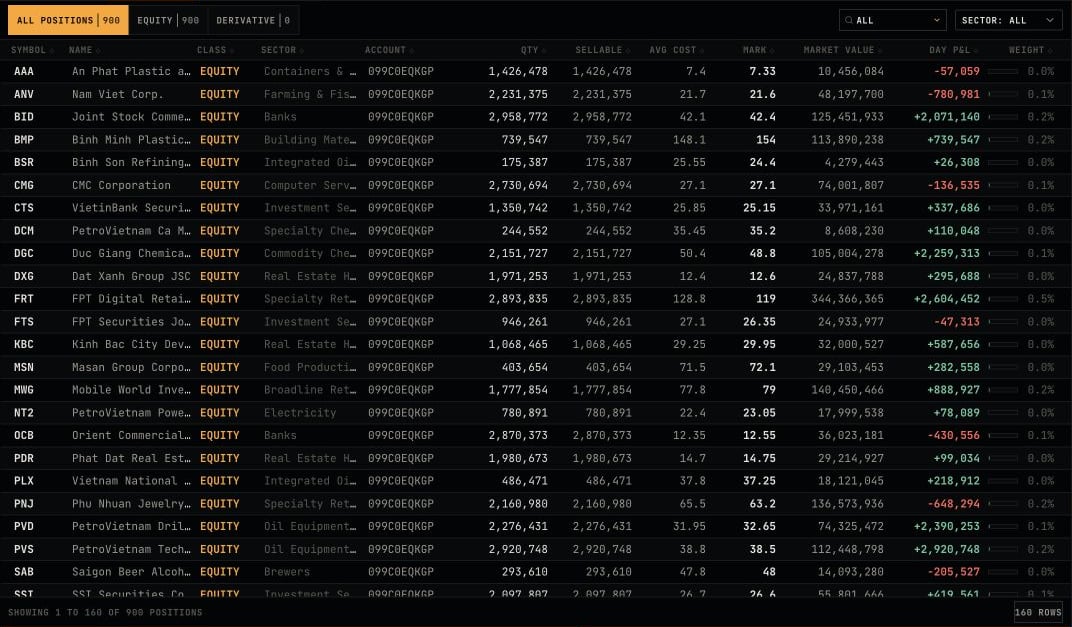
Allocation
The allocation panel displays exposure by asset class, account, sector, and top concentration.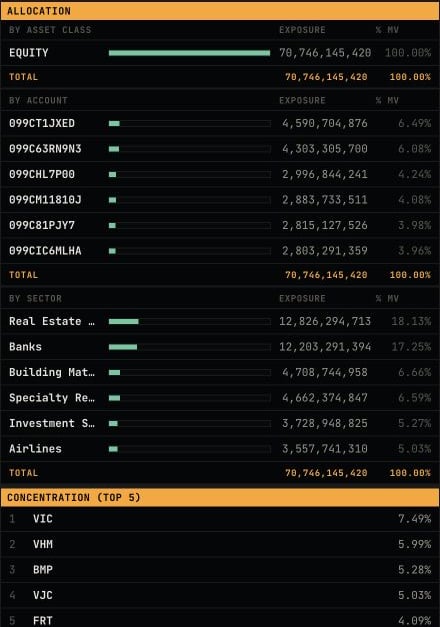
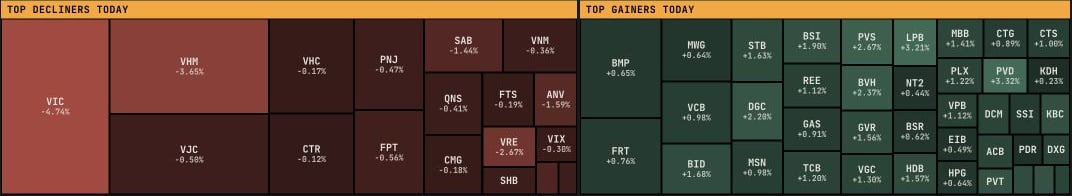
Treemaps
Treemaps classify top decliners and top gainers for the selected portfolio context.